WatchPoint

GDB Python Integration: Debugging with Python in GDB
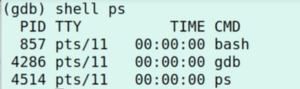
In this episode of gdbWatchPoint we’re going to look at using the GDB python integration. It’s a big topic worthy of its own dedicated screencast series and we’re going to a few episodes. GDB has a really tight integration with python. You can do all kinds of cool things to make really thorny debug problems tractable; plus there’s lots you can do to customize GDB to your particular project. We’re going to use the simple example program that we’ve used previous on gdbWatchPoint: Compile this with Let’s start by invoking the python interpreter in the simplest way we can. Typing The python code isn’t passed to another python process but is run inside the GDB process. We can see this for ourselves using the I can also shell out from GDB using the shell command which I can use to prove that python is running inside the GDB process: This is good to know because it means that python is truly integrated. The python process is long lived within GDB which means variables and methods will persist. For example, if I do: and then: we can see that this returns: Which means foo is still there as 42, so the python inside GDB is stateful allowing you to build up the environment over time. In order to use the python GDB integration, you first need to import the gdb module which gives you lots of cool stuff: The simplest thing this gives you is the In TUI mode, we can use the This shows what can be done, but it isn’t really very interesting. More interesting is when we use the GDB integration properly, which we can do be creating an instance of Now I have the Which shows me the breakpoint is enabled. I can change this with: And so you can begin to imagine what’s possible with the GDB integration with Python. The python inbuilt help for gdb is useful and pretty thorough. For example, to get the help on the That tells me all about the Breakpoint class: You can see that this is how tight the integration is. Pretty much anything that can be done at the GDB command line can be done with a breakpoint from Python. You can attach commands to a breakpoint, make it conditional, ignore a certain number of hits, make the breakpoint specific to a thread or process, and all of the things you can do from the command line. The same is true of most other things in GDB; if you can do it from the GDB command line, you can do it from python. You can see this in the help documentation for the GDB module: Browsing this shows everything which you can do. For example, the higlighted lines are things about the program you’re debugging – your inferior – which allows you to explore the program, blocks, lines and so forth. You can see access to events such as thread One thing we’ll cover in a future episode is how you can trigger functions to run when certain events occur. From all of this, you can pull out of the inferior a lot of the information you need for debugging and the ability to drive GDB. You can create pretty printers and custom commands so you can customize GDB to work better your particular project or in your organization.include <stdio.h>
int
main(void)
{
printf("Hello, world!\n");
printf("That is all, goodbye.\n");
return 0;
}
gcc -g hello.c and launch GDB with gdb o.out.GDB Python – The inner workings
python invokes the interpreter, the python print() function is called and executed when I type end.(gdb) python
> print('Hello world')
> end
Hello world
os.getpid() method:(gdb) python
> import os
> print('I am pid ()'.format(os.getpid()))
> end
I am pid 4286

GDB Python is long-lived
(gdb) python foo = 42
(gdb) python print(foo)
42
Python GDB integration
(gdb) python import gdb
.execute method which feeds a command straight into GDB: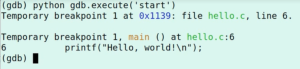
.execute command to create a breakpoint and see it indicated on the left of the source code: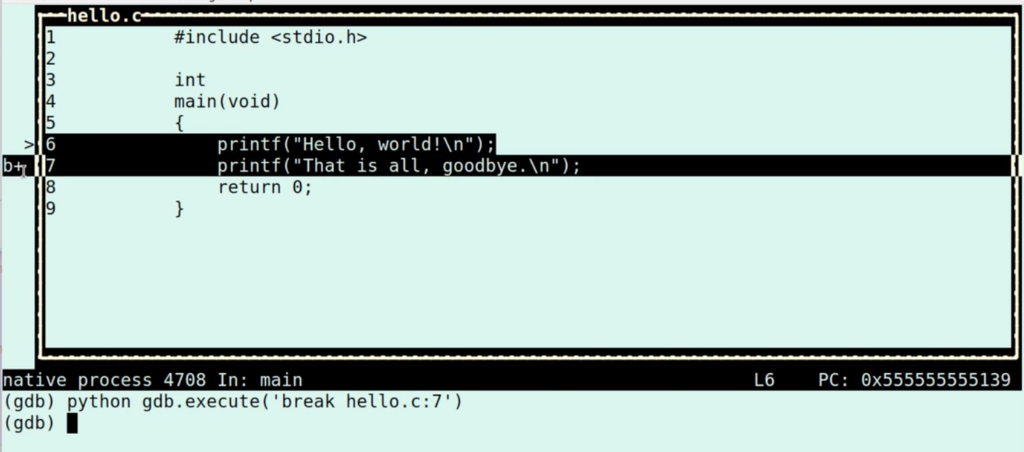
gdb.Breakpoint: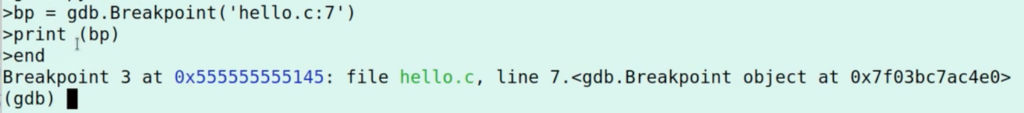
gdb.Breakpoint object, I can start to manipulate and interrogate it. For example, to see if the breakpoint is enabled I can run:(gdb) python print(bp.enabled)
True
(gdb) python bp.enabled = False
Help for python gdb integration
bp object which we created above, run:(gdb) python help(bp)
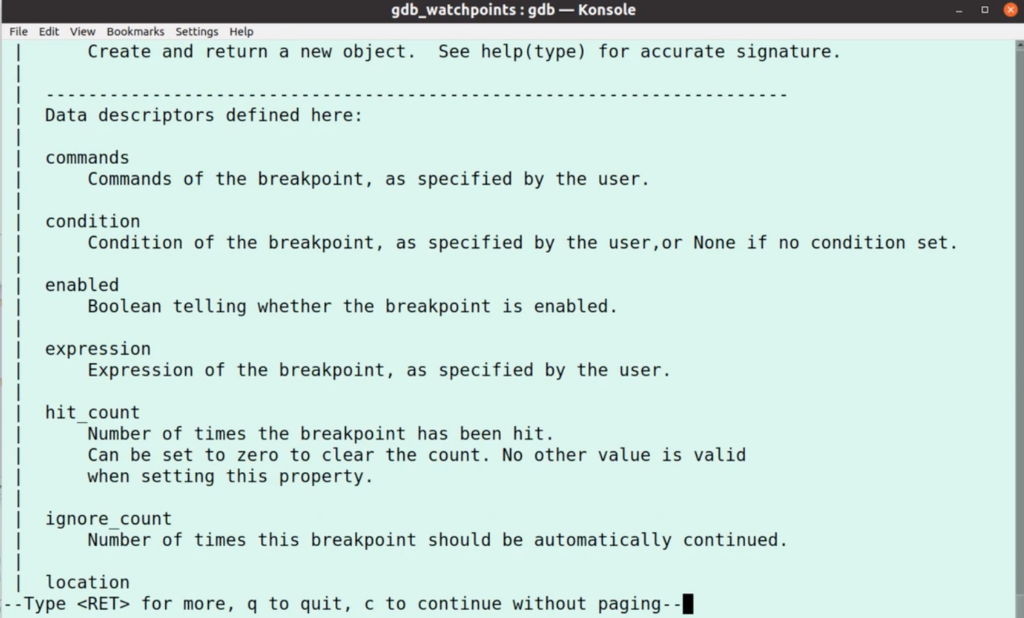
(gdb) python help(gdb)
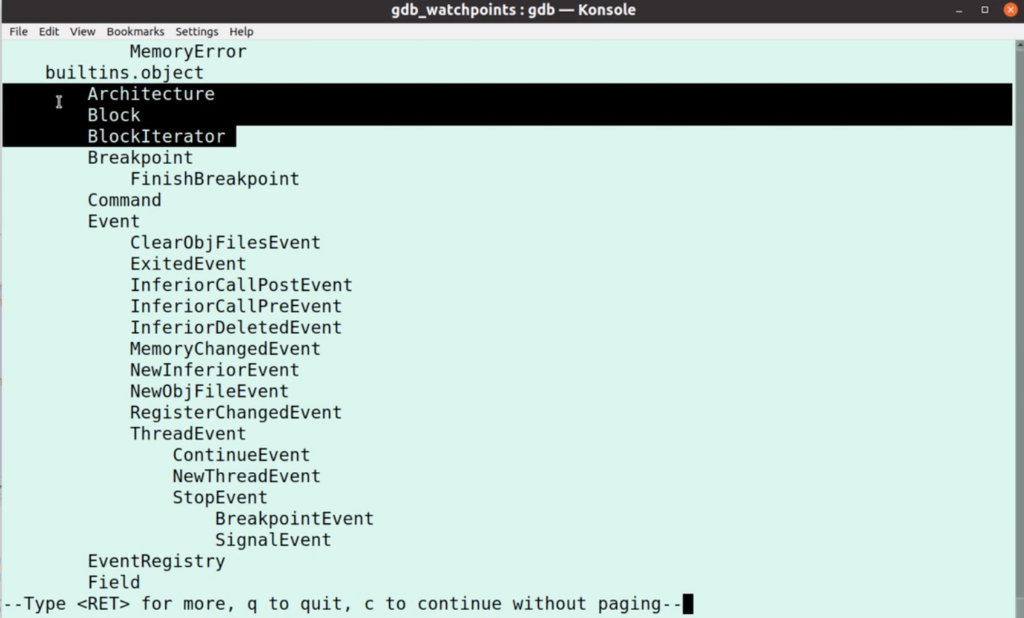
StopEvents, which might come from a BreakpointEvent or SignalEvent.
Want debugging tips directly in your inbox?
Share this tutorial